
Macro Economics Revision notes
Introduction to Macroeconomics
Macroeconomics is a part of economics which is considered with aggregate of the economy and not individual components of an economy.
The main focused area of macroeconomic are:
National income
Unemployment
Aggregated demand
Aggregate supply
Total investment
Total Consumption, etc.
Difference between Macroeconomics and Microeconomics
•Macroeconomics is concerned with aggregated and whole economy whereas Microeconomics is concerned with individual component of an economy •Macroeconomic deals with total demand total supply and national income whereas Microeconomic is concerned with individual demand, individual supply and individual income
•Macroeconomics deals with larger problems of an economy whereas Microeconomics is concerned with smaller and micro level issues
Emergence of Macroeconomics
•Macroeconomic issue predominantly emerged after the Great depression of 1930’s. In 1936 John Maynard Keynes, in his book, “General theory of Employment, interest and money”, promulgated the intervention of government in resolving macro level issues like unemployment, fall in economic growth, stock market crash, huge tariff rates, poverty etc.
•Since than there were two school of thoughts one focused on Pre Keynesian era and other focused on Post Keynesian ear.
Importance of Macroeconomics
•It help in understanding the concept of National income •It highlight the issue of unemployment •It focus on inflation, business cycle •It help in understanding the issue of consumption, saving and investment •It focus on aggregated demand and aggregate supply •It assist in the planning of macroeconomic development policies
Scope of Macroeconomics
National income calculation
Macroeconomic policy formulation
Demand and supply functions
Determination of consumption, saving and Inveatment functions Market based policies formulation
Understanding of international market and policies
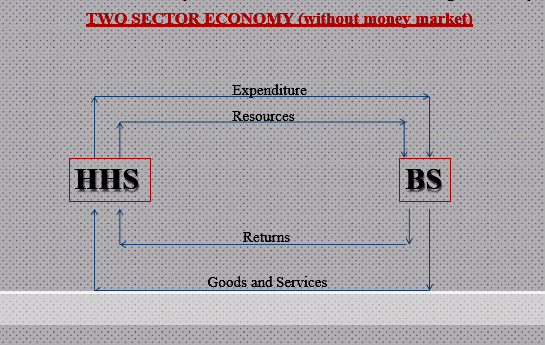
Circular flow income
Circular flow of Income shows the circular flow of income between households and firm in an economy. In an economy households provide production services to the firms to produce certain goods and services and on other hands firm provides factor payment to households i.e. wages for labour, rent and interest etc.
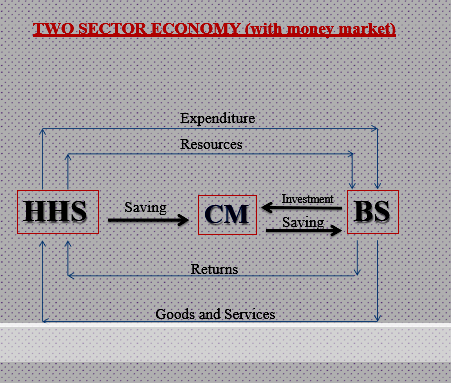
Apart from the above groups, there is a money market, government sector
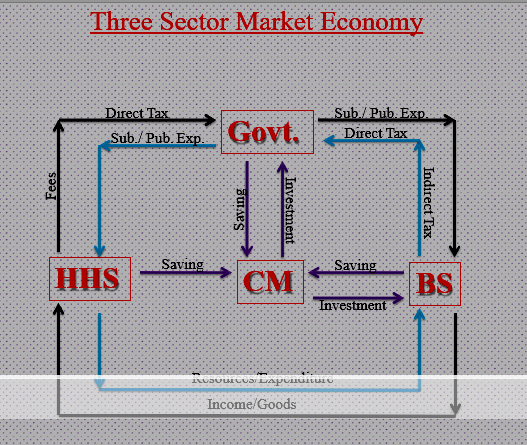
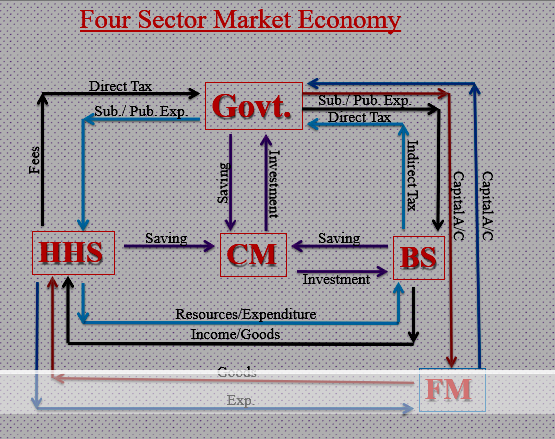
and the foreign trade sector. Firms and householders both deposit their saving into the money market – banks and other financial institution. The inflow of money is followed by the outflow of money in the form of loans raised by the firms as well as the householders. The government raises its revenue through taxation. Money moves from the firms and the householders into the government hand who spend it for its own departments as well as in giving number of facilities. Money thus gets back in the hands of the firm and the HH. Lastly firm export a part of their production abroad. So there is an inflow of money from abroad. But on the other hand when householders import goods and services from the abroad there is an inflow of money from the home country, graphically we can show this flow as follow:
It means we can divide whole country into three sectors
1.Two sector economy – HHS + BS
2.Three sector economy – HHS + BS + Government
3.Four sector economy – HHS + BS + Government + Foreign Economy.
Introduction to National Income
National income is defined as the composite sum of all goods and services produced with the territorial boundary of a country during a specific duration of time.
National income also include the income earned abroad.
There are various terminology under National Income:
GDP
GNP
NDP
NNP
Gross Domestic Product(GDP) & Gross National Product(GNP)
It is the composite sum of all good and services produced within the domestic territory of a country during a specific duration of time.
Gross National Product: It is the sum total of all goods and services produced with the domestic territory of a country during the specific duration of time including income earned abroad.
National Domestic Product and Net National Product
National Domestic Product: It is the sum of all goods and services produced with the territorial boundary of a country within a specific period of time including the adjustment for depreciation and subsidies.
Net National Product: This include the value of goods and services produced with the domestic territory of a country during a particular period of time including net income earned abroad and adjustment of depreciation and subsidies.
NNP (fc) is termed as National Income.
Methods of Measuring National Income
There are three techniques of calculating national income:
Income Method: Under this technique we include all the income of factors of production of a country for a specific duration of time.
Example: Rent, interest, profit and wages.
Expenditure method: As per this method we add all the expenditure incurred by a country during a particular period of time.
Example: Investment expenditure, private expenditure, government expenditure etc
Product method:
As per this method we add the sum of all goods and services produced within the country during any particular period of time.
As per all the three methods of measuring national income, the total income will be the same.
Example:
In a country there are three labour who produces three product: Shoes value of Rs 200, Shirt value of Rs. 300 and Mobile phone value Rs 500. There wages are Rs 200, 300 and 500. After getting their wages they spend all their income in buying household goods. Find National income as per product, income and expenditure method.
Solution:
Product method: Add value of all product- 200+300+500=Rs 1000
Income Method: Add the income of all three labour- 200+300+500=1000
Expenditure: Add the expenses of all the three labour 200+300+500=1000
So as per all the three method the income is same.
Unit-II
Classical theory of Employment
Macroeconomics: J. M. Keynes ( in his contribution the Book, The General Theory of Employment, Interest and Money,1936) has referred all theories contributed by economists prior to him as Classical theory.
Microeconomics : In microeconomics same period is classified under two heads, Classical and
Neo-classical.
classical period is dominated by the work of Adam Smith ( Wealth of Nations , 1776),David Ricardo ( Principles of Political Economy and Taxation, 1st ed., 1817), and John Stuart Mill (Principles of Political Economy , 1st ed., 1848).
neoclassical period , had as its most prominent English representatives Alfred Marshall ( Principles of Economics , 8th ed., 1920) and A. C. Pigou ( The Theory of Unemployment , 1933).
Classical theory of Employment
To classical economists, the equilibrium level of output at any time was a point of full employment or , in terms of the variables, a point when actual output was equal to potential output. Full employment equilibrium exists in short run and long run both as they considered voluntarily unemployed as not matter of concern.
Equilibrium for a variable refers to a state in which all the forces acting on that variable are in balance.
classical economists emphasized the importance of real factors in determining the “wealth of nations” .
Classical theory
They believed in perfectly competitive market to exist in all markets.
Laissez faire or capitalistic economy belief in the efficacy of the free-market mechanism. Say’s law has been one of the principal doctrines used to support the laissez-faire belief that a capitalist economy will naturally tend toward full employment and prosperity without government intervention
Stress on real factors as Money has just one role to play i.e. medium of exchange. money had no
intrinsic value. Money was important only for the sake of the goods it could purchase.
Wage and price flexibility
Classical theory
The Classical Framework: this framework summaries the aggregate economy in terms of four
markets:
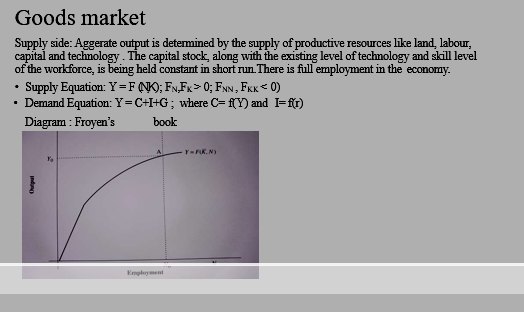
The Goods Market
The Labor Market
The Money ( the Bond) Market
The capital market
Each market is represented by a pair of equations that capture the demand and the supply side respectively. These equations represent aggregative behavior that are not necessarily derived from any explicit micro-founded analysis.
Full-employment will always exist without inflation .The mechanism behind the working of the economy towards full-employment was “an invisible hand”. Any deviations from the full- employment level of output will be corrected within the economy.
Say’s law
Say’s law: “Supply creates its own demand”.
In his principal work, A Treatise on Political Economy (Traité d’économie politique, 1803), Jean-Baptiste Say wrote: “A product is no sooner created, than it, from that instant, affords a market for other products to the full extent of its own value.” And also, “As each of us can only purchase the productions of others with his own productions – as the value we can buy is equal to the value we can produce, the more men can produce, the more they will purchase”.
the ideas of neoclassical economics that held that free markets would, in the short to medium term, automatically provide full employment, as long as workers were flexible in their wage demands
Explanation: Every production of goods also creates incomes equal to the value of goods produced and these incomes are spent on purchasing these goods.
If there are unemployed and idle labours too employing them will not only increase supply of goods (that they will produce) but will get income in return of labour.
Entrepreneur will employ more and more factors till the level of full employment as they are ready to accept income i.e. due to complete price and wage flexibility.
Objections against Say’s law
Over the years, at least two objections to Say’s law have been raised:
General gluts do occur, particularly during recessions and depressions.
Economic agents may collectively choose to increase the amount of money they hold, thereby reducing demand but not supply.
Say’s law was generally accepted throughout the 19th century, though modified to incorporate the idea of a “boom-and-bust” cycle. During the worldwide Great Depression of the 1930s, the theories of Keynesian economics disputed Say’s conclusions.
Scholars disagree on the question of whether it was Say who first stated the principle, but by convention, Say’s law has been another name for the law of markets ever since John Maynard Keynes used the term in the 1930s
Money market
Quantity theory of money: equation of exchange, an identity relating the volume of transactions at current prices to the supply of money times the turnover rate of each unit of money spent.
Cash transaction approach or Fisher’s equation: MV= PT
M=Money supply
V= velocity of money(number of times a unit of money is used to purchase final goods and services in one year)
P= general price level
T= total transaction of good and services
In all these versions, Change in money supply lead to change in price level. M or money supply is fixed by the monetary policy of the government.MV shows total supply of money.PT shows demand side. As they assumed money is demanded only for the sake of exchange.
The Cambridge approach , named after Cambridge University, the academic home of its
originators, Alfred Marshall and A. C. Pigou , Cambridge version of the same equation
Money market
Neutrality of Money:
According to the classical QTM, quantity of money is the only factor that determines price level whereas other factors such as labour supply, demand and production function play no role because these three are real variables.
So neutrality of Money says that the Demand for money is determined only by nominal variables
and real variables have no role in it.
In MV=PT they assumed Y and V as given. That makes this equation as M to be directly and
proportionally related with P.
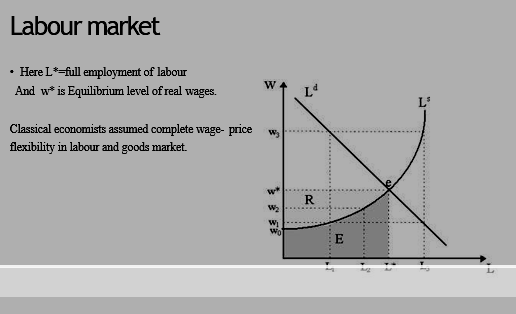
Labour Market
Classical economists assumed that the quantity of labor employed would be determined by the forces of demand and supply in the labor market.
Demand of labor: As a firm employs more and more units of labor, Marginal productivity of labor decreases, this led to succussive demand for them to be at lower real wages.
Supply of labor: Classical economists assumed that the individual attempts to maximize utility (or satisfaction). The level of utility depends positively on both real income, which gives the individual command over goods and services, and leisure. There is, however, a trade-off between the two goals because income is increased by work, which reduces available leisure time.
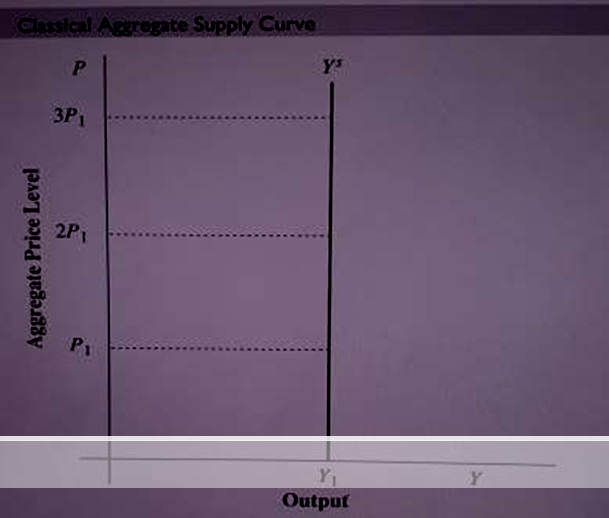
Aggregate Supply curve
• The aggregate supply curve shows the total output firms will supply at each value of the aggregate price level . The vertical classical aggregate supply curve reflects the fact that higher values of the price level require proportionately higher levels of the money wage for labor market equilibrium.
Macro model
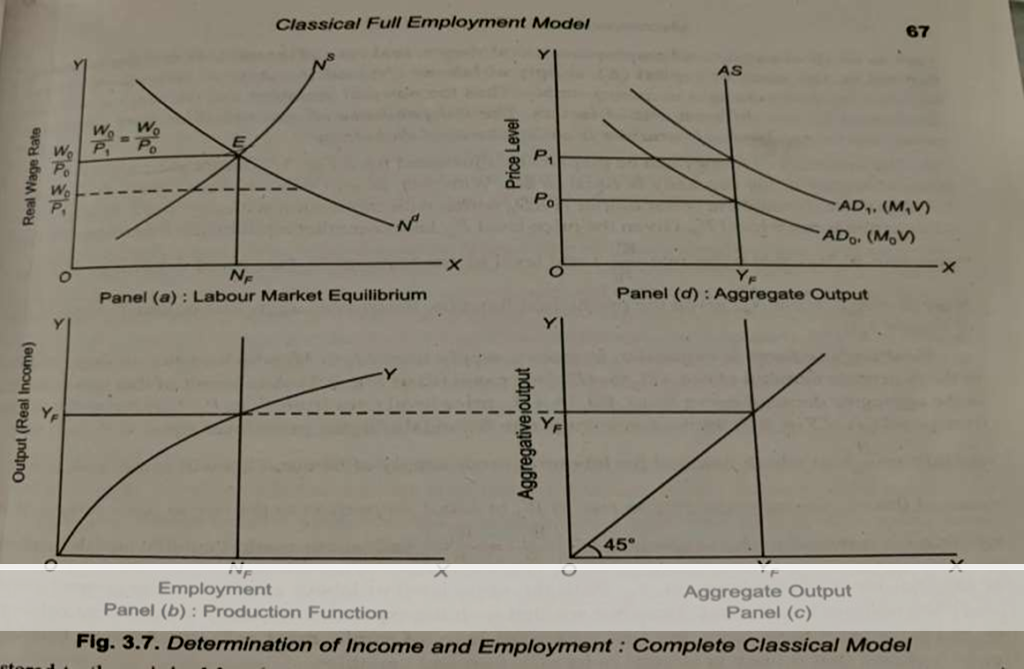
This model represents how different market decision affects each other’s equilibrium. As labour market decides full employment level and real wage level at its equilibrium this led fixation of output produced at such full employment of labour in diagram B. In diagram D this full employment output is expressed as aggregate supply curve which is vertical one . Given downward sloping aggregate demand curve it will fix price level in the market. Any increase in money supply will increase wages and prices in same proportion leaving real variables unaffected . This is also called neutrality of money.
Explanation of Demand Law
J. B. Say stated that there may be some disbalances in the short run but in the long run “Supply creates its own demand”. In the other words in the long run, demand and supply at macro level are always the same.
In the notation; AD = C + I ……..(1)
AS = C + S ……..(2)
In equilibrium AD = AS, or,
C + I = C + S
Classical Model
The classical economists held the view that the economy consists of three market-
Labour Market
Goods Market, and
Money Market
It was argued that the operation of forces of supply and demand in each of these markets would finally result in full employment.
The classical system can be represented by the following set of equations:
Identification of Variables
•Y = Real Output • •N = Employment • •W= Money Wage Rate • •P = General Price Level • •M = Quantity of Money • •K = Fraction of income that is demanded to be held in cash
balance.
Theories of Consumption Function
Absolute Income
Hypothesis Relative
Income Hypothesis
Permanent Income Hyp
thesis Life Cycle Hypothesis
Unit-III
Indian economy is an underdeveloped economy because almost all important features of an underdeveloped economy arc still present in Indian economy. Some of these features are discussed below:
- Low Income:
In India GNP (Gross National Product) per capita was $1,180 in 2009 at current prices, roughly one third of the population is below the poverty line. On world scale, income inequalities between the developed and underdeveloped countries arc very large.
According to the World Hank estimates, in 2009 the average GNP per capita of the high income economies was $38,139 whereas it was $503 in low income underdeveloped countries.
- Predominance of Agriculture:
In India agriculture and allied sectors contribute nearly 14.2 percent of Gross Domestic Product (GDP) according to the 2010-11 estimates released by the Central Statistics Office (CSO).
Moreover, in India agriculture provides employment to around .50 per cent of the workforce.
The share of income in agriculture is however, considerably less than the share of employment in agriculture which clearly reflects the relatively low productivity per labour unit in the agricultural sector.
- Rapid Population Growth Rate and High Dependency Ratio:
High population growth rate is also an indicator of underdevelopment. India’s population growth rate was 1.93% per annum and 21.34 % per decade during 1991-2001, which is still very high as compared to developed economies. Dependency ratio refers to ratio of dependent population (non-working) to total population. In India dependency ratio is around 60% which is very high. This is because of high birth rate and social circumstances.
- Mass Poverty:
According to United Nations Development Programme’s (IJNDP) Global Human Development index 2011. India is ranked 134th among 187 countries. The report says 53 per cent of Indians suffer from multidimensional poverty. The Planning Commission released the second India Human Development Report (HDR) 2011.
The report claims that poverty, unemployment and child labour are declining. According to this report the absolute number of the poor (27 per cent) stood at 302 million as compared to 320 million in 1973. Poverty is widespread in the underdeveloped countries, liven though major progress has been registered over the past 25 years, the absolute number of poor has in fact increased.
- Unemployment and Underemployment:
Unemployment is a phenomenon of all economies whether developed or underdeveloped. But nature and degree of unemployment is different in developed and underdeveloped economies.
In developed economics most of the unemployment is cyclical which arises because of fluctuations in business cycles. In underdeveloped economies like India, chronic unemployment is found which results from the structural defects in the economy.
Moreover, underemployment is widespread in underdeveloped countries. Underemployment is a condition in which a person is getting work but not according to his/her capacity and qualifications.
The 64th round (2007-2008) of NSSO survey on employment- unemployment indicates a creation of 4 million work opportunities between 2004-05 and 2007- 08. The Eleventh Five Year Plan aims at generating 58 million work opportunities in twenty- one high growth sector.
- Inequality:
Inequality in distribution of income and wealth is found in every country but this is wider in underdeveloped economies. In India bottom 40% of rural population possess only 5% of rural assets while 8% top households possess 46% of total rural assets. This disparity is more intensive in urban areas.
- Scarcity of Capital:
Capital is considered as the most important factor in the development of an economy. In underdeveloped economies like India, capital availability per person is very low which results in low productivity and low per capita income. Low per capita income again results in low savings, low investment and low capital formation.
Thus Underdeveloped Countries (UDCs) are caught in the grip of vicious circle of poverty. Lack of capital does not allow an economy to introduce the latest technologies. Thus, economy becomes technologically backward and internationally in competitive.
The CSO’s Quick Estimates for 2009-10 placed gross domestic savings at 33.7 per cent of the GDP at current market prices. With private-sector savings more or less static, ii was the savings of the public sector that went up from a revised level of 0.5 per cent in 2008-09 to 2.1 per cent in 2009-10. In the investment sphere the ratio of gross investment came down to around 36.5 per cent in 2009-10 from 38 per cent in 2007-08.
- Low Level of human Development:
Human Development Index (IIDI) constructed by United Nations Development Programme (UNDP) has become an important indicator of development. IIDI is a composite index of three important parameters of development- education health and income. Every year, in Human Development Report (HDR) value of IIDI is calculated for each country and then they are ranked and classified into three categories high, medium and low human development countries.
According to the UNDP Global Human Development Index (IIDI) 2011. India is ranked 134th among 187 countries.
- Balance of Payments (BoP):
BoP is the systematic record of all economic transactions like trade of goods, trade of services, unilateral transfers, foreign investment, etc. between a country and rest of the world. BoP of a country is also an indicator of development or underdevelopment of the country.
BoP of UDCs like India shows that these countries export primary (agricultural) products and raw materials and import final products and technologies from developed countries.
They invite foreign capital to fill their investment deficiency. India’s BoP is generally unfavourable i.e., it faces deficit. To fill this deficit it has to borrow from other countries and international organisations like IMF, World Bank, ADB, etc. In lieu of loans, these organisations interfere in important policy matters and impose their terms and conditions.
- Social Peculiarities:
High illiteracy rate, male dominated society, joint family system, fatalism, lack of entrepreneurship, casteism, communalism, widespread child labour, etc. are some characteristics of Indian society which distinguish it from developed societies.
India’s planning for development (5-year plans) (Must Read The Important Headline)
NITI AAYOG
Introduction
The NITI Aayog was formed on January1, 2015. The Government, in January 2015, replaced Planning Commission with NITI Aayog (National Institution for Transforming India). In Sanskrit, the word “NITI” means morality, behaviour, guidance, etc. But, in the present context, it means policy and the NITI stands for“National Institution for Transforming India”. It is the country’s premier policy-making institution that is expected to bolster the economic growth of the country. It aims to construct a strong state that will help to create a dynamic and strong nation. This helps India to emerge as a major economy in the world. The NITI Aayog’s creation has two hubs called “Team India Hub”and “Knowledge and Innovation Hub”-
Team India: It leads to the participation of Indian states with the central government.
The Knowledge and Innovation Hub: it builds the institution’s think tank capabilities.
NITI Aayog is additionally creating itself as a State of the Art Resource Centre, with the essential resources, knowledge, and skills that will empower it to act with speed, advance research and innovation, bestow crucial policy vision to the government, and manage unforeseen issues. The reason for setting up the NITI Aayog is that people had expectations for growth and development in the administration through their participation. This required institutional changes in administration and active strategy shifts that could seed and foster substantial scale change.
Aims
To achieve Sustainable Development Goals and to enhance cooperative federalism by fostering the involvement of State Governments of India in the economic policy-making process using a bottom-up approach.
Objectives
- To evolve a shared vision of national development priorities, sectors and strategies with the active involvement of States.
- To foster cooperative federalism through structured support initiatives and mechanisms with the States on a continuous basis, recognizing that strong States make a strong nation.
- To develop mechanisms to formulate credible plans at the village level and aggregate these progressively at higher levels of government.
- To ensure, on areas that are specifically referred to it, that the interests of national security are incorporated in economic strategy and policy.
- To pay special attention to the sections of our society that may be at risk of not benefiting adequately from economic progress.
- To design strategic and long term policy and programme frameworks and initiatives, and monitor their progress and their efficacy. The lessons learnt through monitoring and feedback will be used for making innovative improvements, including necessary mid-course corrections.
- To provide advice and encourage partnerships between key stakeholders and national and international like-minded Think tanks, as well as educational and policy research institutions.
- To create a knowledge, innovation and entrepreneurial support system through a collaborative community of national and international experts, practitioners and other partners.
- To offer a platform for resolution of inter-sectoral and inter departmental issues in order to accelerate the implementation of the development agenda.
The NITI Aayog comprises of the following Members
- The Prime Minister as the Chairperson.
- A Governing Council composed of Chief Ministers of all the States and Union territories with Legislatures and lieutenant governors of Union Territories(except Delhi and Pondicherry).
- Regional Councils composed of Chief Ministers of States and Lt. Governors of Union Territories in the region to address specific issues and contingencies impacting more than one state or a region.
- Full-time organizational framework composed of a Vice-Chairperson, four full-time members, two part-time members (from leading universities, research organizations and other relevant institutions in an exofficio capacity), four ex-officio members of the Union Council of Ministers, a Chief Executive Officer (with the rank of Secretary to the Government of India) who looks after administration, and a secretariat.
- Experts and specialists in various fields.
Features
NITI Aayog is developing itself as a State-of-the-art Resource Centre, with the necessary resources, knowledge and skills, that will enable it to act with speed, promote research and innovation, provide strategic policy vision for the government, and deal with contingent issues.
NITI Aayog’s entire gamut of activities can be divided into four main heads:
- Design Policy & Programme Framework
- Foster Cooperative Federalism
- Monitoring & Evaluation
- Think Tank and Knowledge & Innovation Hub.
Achievements in the year 2019-20
- Collaborative Research Project with Food and Agriculture Organization, United Nations, and India
NITI Aayog and the Food and Agriculture Organization (FAO) of the United Nations signed a memorandum of understanding (MoU) for implementing the Monitoring and Analysing Food and Agricultural Policies (MAFAP) programme in India. MAFAP seeks to establish sustainable systems to monitor, analyse and reform food and agricultural policies to make them more effective, efficient, and inclusive. Globally, MAFAP is being implemented by FAO across fourteen developing and emerging economies. MAFAP analyses are used to inform targeted food and agricultural policy reforms, which will result in a more conducive environment for agricultural investment and productivity growth, especially for small-holder farmers. The MoU for Phase I was effective from 23 September–31 December 2019. Under this phase, the technical cooperation
programme produced intermediate reports on the National Agriculture Price Policy for selected agriculture produce market committees in Haryana and Odisha, and the National Food Security Policy for selected districts in Chhattisgarh and Bihar. Subsequently, considering the short timeline available under Phase I, the MoU was proposed to be renewed in order to commence Phase II of the technical cooperation programme from January 2020 to December 2021.
- Cooperative Federalism–State of Uttarakhand
The agriculture vertical consulted respective ministries on various issues raised by the Chief Minister of Uttarakhand in the fourth and fifth Governing Council meetings of NITI Aayog. The vertical monitored and expedited the settlement of issues raised by the state in coordination with Central ministries. NITI Aayog also arranged review meetings to discuss developmental matters and rural migration in the presence of Member (Agriculture). To take it forward, another meeting was proposed in December 2019 in Dehradun. In addition, the vertical appraised a number of externally funded projects (EAPs) proposed by the state besides the review of ongoing activities of the state.
- Doubling of Farmers’ Income
In pursuance of the decision taken in the fifth Governing Council meeting of NITI Aayog, the Prime Minister announced the setting up of a high-powered committee of chief ministers for transforming Indian agriculture.In itsfirst meeting on 18 July 2019, the committee discussed ways to incentivize the states to implement various reforms in agriculture. The committee emphasized the need to accelerate the growth of the food-processing sector, modalities to draw more investment in agriculture, subsidy on drip irrigation, water conservation, including the need to stress upon required amendments to the Agricultural Produce Market Committee Act and Essential Commodities Act.
- Ensuring the Implementation of Minimum Support Price (MSP), Including PM-AASHA
In the Budget of 2018–19, there was an announcement that NITI Aayog, in consultation with Central and state governments, will develop a foolproof mechanism so farmers can get remunerative price for their produce. A meeting of Central ministries, states and union territories was held on 9 March 2018 under the chairmanship of NITI Aayog Vice Chairman Dr Rajiv Kumar to discuss about the mechanism of implementation of MSP for the selected agricultural produce or to provide MSP to the farmers through some other way. As an outcome of the discussion, the Ministry of Agriculture and Farmers’ Welfare rolled out new schemes—Pradhan Mantri AnnadataAaySanrakshan Abhiyan (PM-AASHA), Price Deficiency Procurement Scheme (PDPS), Price Support Scheme (PSS) and Private Procurement and Stockiest Scheme (PPSS)—for procurement of notified crops from farmers.
- Promotion of Village Storage Scheme
A meeting was held under the chairmanship of NITI Aayog CEO Amitabh Kant on l7 May 2019 to discuss the strategies to be adopted for the Village Storage Scheme. Ways to enhance village-level storage facilities were critically deliberated.
While participating in the discussions, CEO, National Centre for Cold-chain Development (NCCD), Department of Agriculture, Cooperation and Farmers’ Welfare (MOA&FW) mentioned that the Village Storage Scheme should address basic four categories of produce:
- Hardy food crops like grains
- Long-holding perishables (iii Short-life perishable crops
- Produce like cotton, wool, industrial feedstock, which serve as raw material to the non-food industry
It was further quoted that holding of perishables in refrigerated village stores may not promote the development of a suitable post-harvest supply chain but would instead delay the problem of establishing a supply line to market channels, leading to deferred distress. It was suggested that village-storage and post-harvest facilities may primarily be set up at Gramin Agricultural Markets as an interface of APMC and farmers, which would provide preconditioning and connectivity to any market or user or organized storage in the country. It was also decided that the National Bank for Agriculture and Rural Development in collaboration with the National Centre of Geo-Informatics would create a portal and evolve a mechanism for geotagging warehouses, including the refrigerated ones done in base-line survey for cold storages, all over India.
Indian Agriculture: Issues and Challenges
Agricultural sector employs more than half of the labour force in developing countries. It is important in terms of employment, production and consumption, can continue to play a critical role in lifting people out of poverty. This sector is important for two reasons: i) poor household tends to spend a large share of their income on food; and ii) three out of four people live in rural areas in developing countries and most of them depend on agriculture for their livelihoods. Evidence suggests that growth in agriculture delivers more poverty reduction than growth in other sectors in low-income economies. Moreover, virtually all economies that managed to reduce poverty significantly went through a period of increased agricultural productivity. This positive effect on poverty also materializes if agricultural productivity is enhanced through integration in global value chains (World Trade Report, 2014:09). Developing countries are faced with various challenges such as reduction in farm size, dwindling water resources, and lack of access to financial institutions, high degrees of market concentration, which seem evident in some segments of agricultural value chains, can also undercut bargaining positions of small producers in developing countries. Agricultural productivity growth is vital for stimulating growth in other parts of the economy. But accelerated growth requires a sharp productivity increase in smallholder farming combined with more effective support to the millions coping as subsistence farmers, many of them in remote areas. Agriculture is therefore of utmost importance to development strategies in the developing world. Growth in agriculture has now to increasingly come from non-price factors. Markets for agricultural commodities have to be made more competitive in the interest of both producers and consumers. Indian agriculture sector has entered a challenging phase and the thrust of government policies needs to be oriented towards enhancing investment in irrigation infrastructure. This in turn has to be supplemented by smarter outreach to introduce better technology.
Unemployment in India
Unemployment is a common economic malady faced by developed as well as developing countries. But the nature of unemployment prevailing in the under-developed or developing countries sharply differs to that of developed countries of the world. Unemployment in developed countries occurs because of lack of aggregate demand, mostly of Keynesian involuntary and frictional type, and cyclical unemployment but unemployment in developing countries occurs because of structural changes, what is called structural unemployment that arise from high rate of growth population and slow rate of economic growth. besides, it faces disguised, open, and under-employment.
As per Periodic Labour Force Survey estimates, the share of regular wage/salaried employees has increased by 5 percentage points from 18 per cent in 2011-12 to 23 per cent in 2017-18 as per usual status. In absolute terms, there was a significant jump of around 2.62 crore new jobs in this category with 1.21 crore in rural areas and 1.39 crore in urban areas. Total formal employment increased from 8 per cent to 9.98 per cent in 2017-18. In absolute terms, the number of workers with formal employment increased from 3.8 crore in 2011-12 to 4.7 crore in 2017-18.1 Government must focus on general education and vocational education. General education improves knowledge of the people while skill training enhances their employability and equip them to tackle requirements of labour market
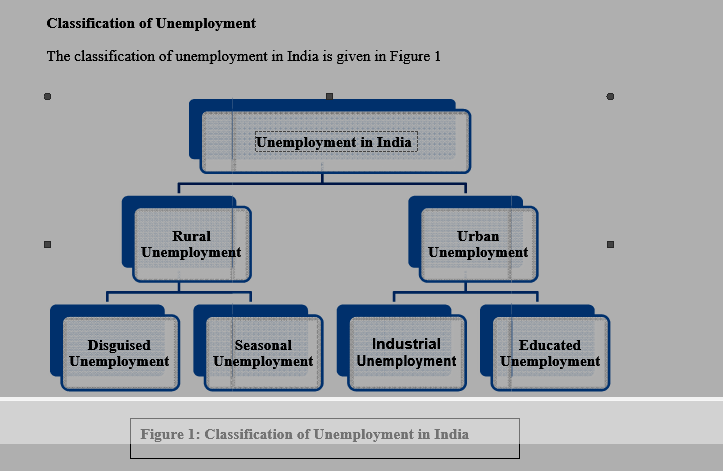
Seasonal unemployment occurs simply because agriculture is a seasonal occupation. Crops are grown according to seasons. During off-seasons, usually the farm workers become unemployed.
Structural unemployment and frictional unemployment are sometimes treated as two
variants of secular unemployment – the unemployment that tends to persist, while cyclical
unemployment appears and disappears in assonance with the cyclical phases of the economic activities.
Labour-Intensive Industries
India has a comparative advantage in the labour-intensive activities and the imperative of
creating employment for growing labour force. There are two groups of industries in India that hold the greatest potential for export promotion and job creation.3 First, there exists a significant unexploited export potential in India’s traditional unskilled labour-intensive industries such as textiles, clothing, footwear and toys.4 The global value chains (GVCs) in these industries are controlled by “buyer driven” networks wherein lead firms that are based in developed countries concentrate in higher value added activities such as marketing, branding and design, while firms
3
in developing countries carry out physical production through sub-contracting arrangements. For instance, the production networks of Wal-mart, Nike, Adidas etc.5
Second India has huge potential to emerge as a major hub for final assembly in range of products, referred to as network products (NP).
Multinational enterprises control global value chains in these industries such as Apple, Samsung, Sony etc. “producer driven” networks. In these industries products are not produced from start to finish in one country. Within the production network, each country specializes in the each stage of the production or specialize in particular tasks based on country’s comparative advantage. For example, labour abundant countries like India and China specialize in low-skilled labor-intensive stages of production such as assembly while the richer countries specialize in capital and skill-intensive stages such as Research and Development (R&D). Countries like the United States of America, European countries and Japan specialize in skill and knowledge-intensive stages of production but locate assembly related activities in low wage nations like India,7 China and Vietnam.
Important Points to Remember
- Unemployment is a common economic malady faced by developed as well as developing countries. But the nature of unemployment prevailing in the under-developed or developing countries sharply differs to that of developed countries of the world.
- Unemployment in developed countries occurs because of lack of aggregate demand, mostly of Keynesian involuntary and frictional type, and cyclical unemployment but unemployment in developing countries occurs because of structural changes, what is called structural unemployment
- Structural unemployment and frictional unemployment are sometimes treated as two variants of secular unemployment – the unemployment that tends to persist, while cyclical unemployment appears and disappears in assonance with the cyclical phases of the economic activities.
Unit-IV
A transversal classification distiguish inflations, basing on their broadly-defined origins:
1.domestic demand;
2.domestic costs, as wages;
3.external sources, as oil price increases or currency relative devaluation.
A systematic institutional difference is between countries having or not having (partial or total) indexation of wages (and other income sources).
Indexation makes inflation much less painful, but normally keeps it at a higher level and increases the risk of a continous acceleration.
Determinants
A widely dispersed price increase as it is, inflation is the immediate result of firms’ decisions.
These decisions may result from coordination and monopoly/oligopoly dynamics, as well as from the attempt to increase margins and profits.
But there is no need for formal coordination: a favourable demand situation, with higher income and booming propensity to consumption, makes price increase easier.
A generalized cost increase, as with wages, energy prices (especially oil
prices), devaluation, and certain taxes, is clearly conducive to inflation. A
mediation is given by of production.
p roductivity improvements, which reduce unitary costs
Conversely, extensive liberalizations in sectors where prices were rising can lead to a lower inflation rate, thanks to the new entrants and the tougher competition.
Increases in minimum wages can be reflected in one-time increase of the price level, distributed over a time period, to the extent the workers paid at that level is a share of the total workforce and the total payroll is a share of total costs [1].
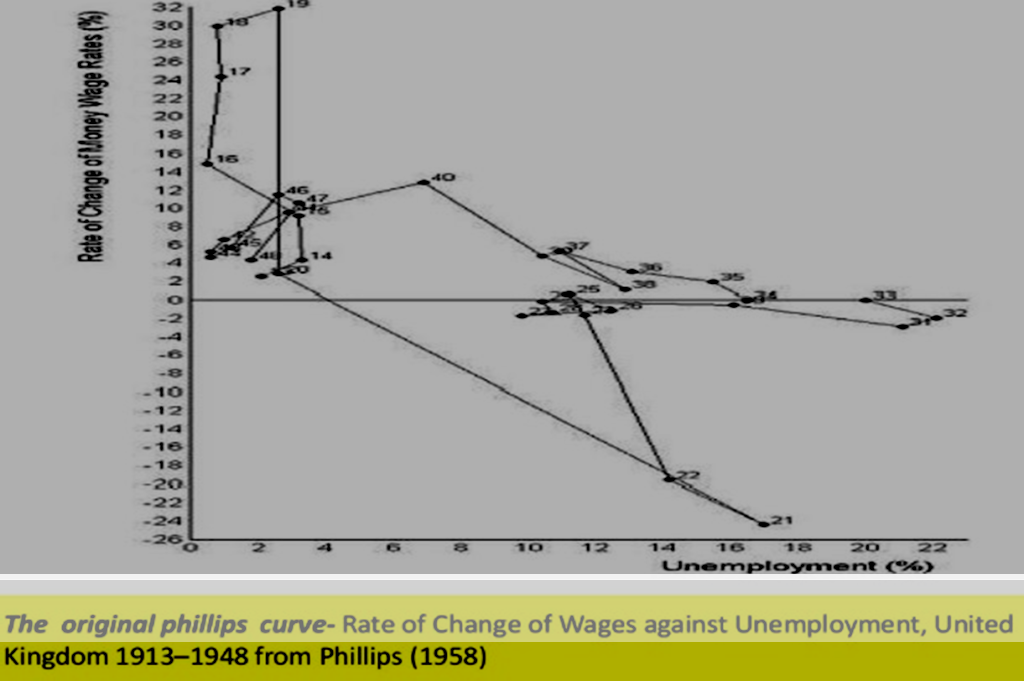
•A.W. Philips wrote a paper in 1958 titled “The relation between Unemployment and the Rate of Change of Money Wage Rates i n the United Kingdom,1861-1957, which was published in the quarterly journal Economica”
•The Philips Curve shows the historical i nverse relationship b etween the rate of unemployment and the rate of inflation in an economy (lower the unemployment in the economy, higher the inflation and vice-versa)
•It has been observed that there is a s table short run trade off b etween unemployment and inflation. However, this phenomenon hasn’t been observed in the long run.
Original Philips Curve
Keynesian Views
•This relationship identified by Philips was seen as support for Keynesian policies, which focuses on pump priming by the Government to accelerate the level of economic activity and reducing unemployment in the short run.
•In the 1970’s the relationship between Unemployment and Inflation seemed to break down. The Oil Crisis saw developed economies experience low growth and rising inflation and unemployment at the same time.
•This was a novel phenomenon, Paul Samuelson coined the word S tagflation for this phenomenon. His observations were recognized as in support of Monetarists and against Keynesians.