Statistical Methods Revision Notes
Origin of Statistics
• The word ‘statistics’ comes from the italian word ‘statista’(meaning ‘Statesman’) or the German word ‘statistik’ which means a Political state.
• It was first used by Professor Gottfried Achenwall (1719-1772), a Professor in Marlborough in 1749 to refer to the subject- matter as a whole.
• The science of statistics is said to have originated from two main sources:
(a) Government Records
(b) Mathematics
Meaning of Statistics
• At the outset, it may be noted that the word ‘Statistics’ is used rather curiously in two senses-plural and singular.
• In the plural sense, it refers to a set of figures i.e. Data. Thus, we speak of data related to production and sale of textiles, Income of 500 employees of an organization and so on.
• In the singular sense, statistics refers to the whole body of analytical tools that are used to collect the figures, organize and interpret them and, to draw conclusions from them.
Definition of Statistics
Using the term ‘Statistics’ in the singular sense, Spiegal defines Statistics as: ‘Statistics is concerned with scientific method for collecting, organising, summarising , presenting and analysing data as well as drawing valid conclusions and making reasonable decisions on the basis of such analysis.’
Definition of Statistics
Using the term ‘Statistics’ in the plural sense, a complete definition of Statistics has been given by Horace Secrist. He defines Statistics as: ‘aggregate of facts, affected to a marked extent by multiplicity of causes, numerically expressed, enumerated or estimated according to reasonable standards of accuracy, collected in a systematic manner for a predetermined purpose, and placed in relation to each other’.
Characteristics of Statistics
Based on the above definition following characteristics of statistics as data can be pointed out:
• Aggregate of facts
• Numerically expressed
• Enumerated or estimated
• Reasonable standard of accuracy maintained
• Collected in a systematic manner
• Collection as per the predetermined purpose
• Capable of being placed in relation to each other
Function of Statistics
We should know what different fields are included in the ambit of statistics. Whether a given problem pertains to business or to some other fields. Following are the various activities of statistical study which describe the function of statistics:
i.Formulation of the Problem: To begin with, we have to formulate a problem on which a study is to be done.
ii.Objective of Study: We should know what the objectives of the proposed study are.
• Determining Sources of Data: The problem and the objectives, thus properly understood, will enable us to know as to what data are required to conduct the study.
• Designing Data Collection Forms: Once the decision in favour of collection of primary data is taken, one has to decide the mode of their collection.
• Conducting the Field Survey: Side by side when the data collection forms are being designed, one has to decide whether a census survey or a sample survey is to be conducted.
• Organising the Data: It is now necessary to organise these data in the form of suitable tables and charts so that we may be aware of their salient features.
• Analysing the Data: On the basis of the preliminary examination of the data collected as well as the nature and scope of our problem, we have to analyse data.
• Reaching Statistical Findings: The analysis in the preceding step will bring out some statistical findings of the study.
• Presentation of Findings: Finally, we have to present the findings of the study, properly interpreted, in a suitable form. Here, the choice is between an oral presentation and a written one.
Scope of Statistics
The scope of statistics can be classified into two main categories:
i. Statistical Methods
ii. Division or Classification of Statistics
i. Statistical Methods: It refers to various devices used by a researcher for clarifying the numerical facts and then deriving the results there from. The main methods are discussed as under:
a. Collection of Data
b. Organisation of Data
c. Presentation
d. Analysis
e. Interpretation
f. Forecasting
Division or Classification of Statistics
a. Collection of Data: This is the basic method of any Statistical investigation. Data are collected according to purpose and research plan prepared in advance.
b. Organisation of Data: Organisation refers the editing, coding, classification and tabulation of data.
c. Presentation: Data can be presented by mainly three methods namelyi. Statistical Tables
ii.Diagrams
iii. Graphs
d. Analysis: This an important step in which numerical facts are put into the statistical machinery for their examination and analysis with the help of several statistical tools.
e. Interpretation: The most crucial step of the statistical investigation is finding out conclusion and interpreting the results in clear and understandable language.
f. Forecasting: It is another step where researcher makes a forecasting as much correct as possible, this forecasting can be made on the basis of analysing past and present data.
ii. Division or Classification of Statistics: Statistics or data can also be classified on the basis of their nature and function as following:
a.Descriptive Statistics
b.Analytical Statistics
c.Inductive Statistics
d.Applied Statistics
Scope of Statistics
a. Descriptive Statistics: It is related to those methods which are helpful in describing the original characteristics of the observations (data). The descriptive measures of statistics become the ground for further statistical analysis. They comprise methods used in collection and tabulation, averages, trends, index numbers, dispersion, skewness etc.
b. Analytical Statistics: Analysis of data is made through establishing a relationship between two or more variables or by making comparison between two or more sets of data. Information relating to two groups or two time periods are compared with each other.
c. Inductive Statistics: The techniques which are used to draw correct and needful conclusion about the universe through samples, estimating and forecasting the future events, decision-making etc. are covered under inductive statistics.
d. Applied Statistics: It consists of various statistical techniques and processes which are applied in the real life situations. They are used to enquire into the many social and economic aspects of the nation.
Introduction
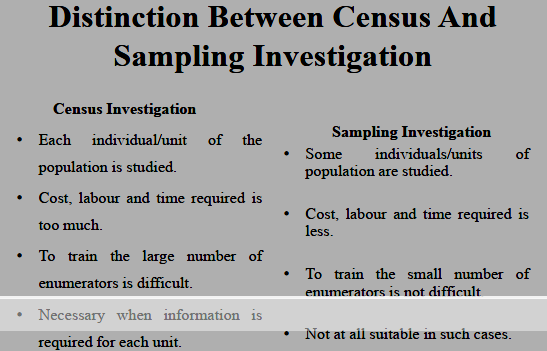
• In order to make a study on any specific subject or phenomenon, a researcher can use either of following two important Investigation methods:
- Census Investigation
- Sampling Investigation
Important Basic terms
Before explaining about these sampling method, it is essential to understand the important basic terms related to them. These are: Sampling Unit A sampling unit is an element or a group of elements, living or non-living, from which or about which information is collected. For example, a household in the city, an employee in any firm, branch of a bank, any electronic product etc.
Sampling Frame
It is a list of all the homogeneous units with their identifications which is prepared to select some units for a sample. For example, all houses in a particular locality/colony, list of all employees working in a section of the organisation could constitute a sampling frame. In some cases, the sampling frame may also include some auxiliary information.
Population
The collection of all the units of a specified type pertaining to the area of investigation, at a particular point or period of time is called a population or universe. For example, the persons or households in a given city, the accounts at a branch of a bank, students studying in a University could constitute a population.
Sampling Method
Under this method:
• Study about a part of the whole universe.
•Information about selected units is gathered.
• A purposeful enquiry on this sample is made.
• Sampling method is based on the assumption that basic characteristics of the items selected in sample are almost same as those of universe.
• The results obtained from sample study can be applied to the wholeuniverse or population.
• A study of a sample will provides a correct idea of the universe or population.
Applications of Sampling Method
• A house-wife tests a little quantity of rice to ascertain whether it’s been well-cooked, but won’t inspect all the rice.
• The physician makes inferences about a patient’s blood through examination of a single drop.
• The other examples of sampling may be: a grain merchant does not examine each grain of what he purchases; similarly a fruit merchant does not inspect each fruit, but inspects only a few of them.
•In all these cases, by inspecting a few, they simply believe that the samples give a correct idea about the population.
Merits And Demerits of Sampling
Merits of Sampling
• Sampling provides more detailed information, As it saves time, money and energy, we collect more detailed information in a sample survey.
• Highly qualified and skilled persons can be deployed for collection of data as the manpower requirement is relatively low.
• It is indispensable or must if it gets destroyed (items like, bullets, fuses) or gets consumed (e.g. fruits) or becomes useless (item like an electric bulb, tube light) in the process of getting the desired information about the unit.
Demerits of Sampling
• Sampling investigation is not suitable if higher order accuracy is required.
• The results of sample investigation may be false, inaccurate and misleading in the following cases:
i. If sample is not drawn properly
ii. If sample is not a representative of the population.
iii.If sample size is too small.
Merits And Demerits of Sampling
Demerits of Sampling
• The investigator’s personal bias regarding the choice of units and drawing of sample lead to false conclusion.
• The sample method is unnecessary in case of small population .
• When the population is not homogeneous then sample investigation is not so useful.
• Sample investigation method is not suitable if information is required about each individual of the population.
Essentials of a Good Sample
To draw unbiased conclusion, the following properties are required in a good sample:
• Representativeness
• Similarity and Homogeneity
• Independence
• Adequacy
• Similar regulating conditions
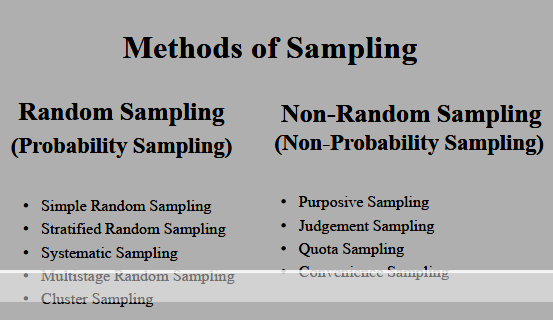
Methods of Sampling
• The process of selecting some items out of the total items in a universe for the study purposes is called sampling. There are two broad categories of methods used for selecting items:
- Random or Probability Sampling
- Non-Random or Non-Probability Sampling
The choice of a sampling method or technique mainly depends upon the purpose of the investigation. The nomenclature of sample depends on the method of sampling used.
Random Sampling (Probability Sampling)
Meaning
The method of sampling in which each unit of the population has an equal probability or chance of being selected in the sample, is called Random
Sampling (or sometimes simple random sampling) or unrestricted random sampling and the sample so drawn is called random sample.
Simple Random Sampling
Several devices have been adopted for random selection of the units from the population. These are:
a. Lottery System
b. Table of Random Number
a. Lottery System
This is the most popular and simple method where items of the universe are numbered on separate slips of uniform size and colour. They are folded and mixed up in a drum or container. A blindfold selection is made. The required number of slips are selected for the desired sample size.
For instance , if we need to pick 5 students out of eighty students in a class, then we must write the names of all the 80 students on slips of an equivalent size and blend them; then we make a blindfold selection of 5 students. There’s a lot of possibility of personal prejudice if the dimensions and shape of the slips aren’t identical.
b. Tables of Random Number
• This is a scientific and systematic method where a random table containing thousands of random numbers has been developed.
• The main credit for this techniques goes to Prof. L.H.C. Tippett (1927).
• The random number table (taken from the British Census Report) consists of 10,400 four-figured numbers giving in all 10,400 x 4 = 41,600.
• There are various other random numbers. They are Fisher and Yates (1938 ) consisting of 1,00,000 digits grouped in 25,000 sets of 4 digited random, Rand Corporation (1955 )consisting of 2,00,000 random numbers of 5 digits each, etc.
Techniques of Random Sampling
• Stratified Random Sampling
This method is useful in case of heterogeneity among the population. It involves classifying the population into certain number of nonoverlapping homogeneous groups called strata. Then selection of some items is made from each stratum independently on random basis. Selection from each stratum may be either proportionate or disproportionate basis. For example, in India, the entire population can be classified in three strata as lower income group, middle income group, and higher income group. Then some pre-decided items are selected from all three groups so as to ensure full representation
• Cluster Sampling
A group of elementary units in the population is known as a cluster. When a cluster is considered as a sampling unit, i.e., some of the clusters are selected in the sample and are examined completely, then the sampling procedure is called cluster sampling.
In this method a cluster consists of many units which may be of heterogeneous nature. Unit of selection is a whole cluster which is selected out of so many clusters made from universe. Sometimes further samples may be taken from the clusters selected.
Unit-III
Two or more variables are said to be correlated if the change in one variable results in a corresponding change in the other variable.
According to Simpson and Kafka, “Correlation analysis deals with the
association between two or more variables”.
Lun chou defines, “ Correlation analysis attempts to determine the degree of relationship between variables”.
Boddington states that “Whenever some definite connection exists between two or more groups or classes of series of data, there is said to be correlation.”
In nut shell, correlation analysis is an analysis which helps to determine the degree of relationship exists between two or more variables.
Correlation Coefficient:
Correlation analysis is actually an attempt to find a numerical value to express the extent of relationship exists between two or more variables. The numerical measurement showing the degree of correlation between two or more variables is called correlation coefficient. Correlation coefficient ranges between -1 and +1.
Significance Of Correlation Analysis
Correlation analysis is of immense use in practical life because of the following reasons: 1.Correlation analysis helps us to find a single figure to measure the degree of
relationship exists between the variables. 2.Correlation analysis helps to understand the economic behavior. 3.Correlation analysis enables the business executives to estimate cost, price
and other variables. 4.Correlation analysis can be used as a basis for the study of regression. Once we know that two variables are closely related, we can estimate the value of one variable if the value of other is known. 5.Correlation analysis helps to reduce the range of uncertainty associated with decision making. The prediction based on correlation analysis is always near to reality. 6.It helps to know whether the correlation is significant or not. This is possible by comparing the correlation co-efficient with 6PE. It ‘r’ is more than 6 PE, the correlation is significant.
Classification of Correlation
Correlation can be classified in different ways. The following are the most important classifications 1.Positive and Negative correlation 2.Simple, partial and multiple correlation 3.Linear and Non-linear correlation
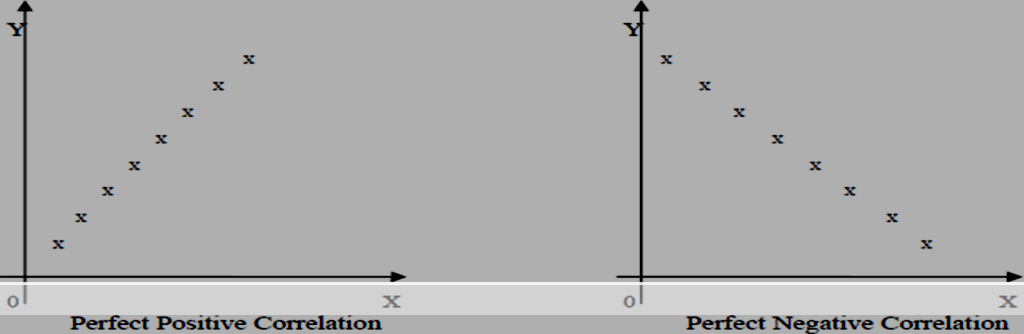
Degrees of correlation
Correlation exists in various degrees 1.Perfect positive correlation 2.Perfect Negative correlation 3.Limited Degree of Positive correlation 4.Limited degree of Negative correlation 5.Zero Correlation (Zero Degree correlation)
Methods of measuring correlation
Correlation between 2 variables can be measured by graphic methods and algebraic methods. I.– Graphic Methods 1)Scatter Diagram 2)Correlation graph ● II.– Algebraic methods (Mathematical methods or statistical methods or Co- efficient of correlation methods): ● 1)Karl Pearson’s Co-efficient of correlation 2)Spear mans Rank correlation method 3)Concurrent deviation method
Scatter Diagram:
This is the simplest method for ascertaining the correlation between variables. Under this method all the values of the two variable are plotted in a chart in the form of dots. Therefore, it is also known as dot chart. By observing the scatter of the various dots, we can form an idea that whether the variables are related or not.
A scatter diagram indicates the direction of correlation and tells us how closely the two variables under study are related. The greater the scatter of the dots, the lower is the relationship

Merits of Scatter Diagram method
1.It is a simple method of studying correlation between variables.
2.It is a non-mathematical method of studying correlation between the variables.
It does not require any mathematical calculations.
3.It is very easy to understand. It gives an idea about the correlation between variables even to a layman
. 4.It is not influenced by the size of extreme items. 5.Making a scatter diagram is, usually, the first step in investigating the
relationship between two variables.
Demerits of Scatter diagram method 1.It gives only a rough idea about the correlation between variables.
2.The numerical measurement of correlation co-efficient cannot be calculated under this method.
3.It is not possible to establish the exact degree of relationship between the variables.
Correlation graph Method
Under correlation graph method the individual values of the two variables are plotted on a graph paper. Then dots relating to these variables are joined separately so as to get two curves. By examining the direction and closeness of the two curves, we can infer whether the variables are related or not. If both the curves are moving in the same direction( either upward or downward) correlation is said to be positive. If the curves are moving in the opposite directions, correlation is said to be negative.
Merits of Correlation Graph Method 1.This is a simple method of studying relationship between the variable 2.This does not require mathematical calculations. 3.This method is very easy to understand
Demerits of correlation graph method 1.A numerical value of correlation cannot be calculated
. 2.It is only a pictorial presentation of the relationship between variables.
3.It is not possible to establish the exact degree of relationship between the variables.